
Why 94% of Our Leads Were Wrong
A UX investigation into disqualified leads revealed an unexpected behaviour pattern, and one redirect fixed everything.
Project overview
- Company
- Hand Talk
- Date
- Q4 2022
- Scope of work
- UX Research
- Behavioral Analysis
- Optimization
- My role
- UX Designer
- Collaborated with
- Sales team
- Head of Design
- Head of Web Development
About Hand Talk
Hand Talk is an award-winning accessibility platform that uses AI to translate digital content into sign language through virtual avatars. Hand Talk was acquired by Sorenson (opens in a new tab), a global language services provider and the leader in communication solutions for the Deaf and hard-of-hearing communities.

Problem
The Sales team raised a red flag:
"We're getting many leads, but most are low quality or completely off-target. Could bots be attacking the form?"
- Lead volume spiked, and 94% were disqualified after review.
- Sales were overwhelmed, spending hours trying to qualify users who were either consumers or didn't respond.
Analysis
The plugin had two redirect paths to the landing page, and Google Analytics tracked every redirection event.
Loading screen
Reached through the “Developed by Hand Talk” link that appears while the plugin loads.
About Us screen
Reached deliberately, through the “Hand Talk” button inside the plugin's About section.
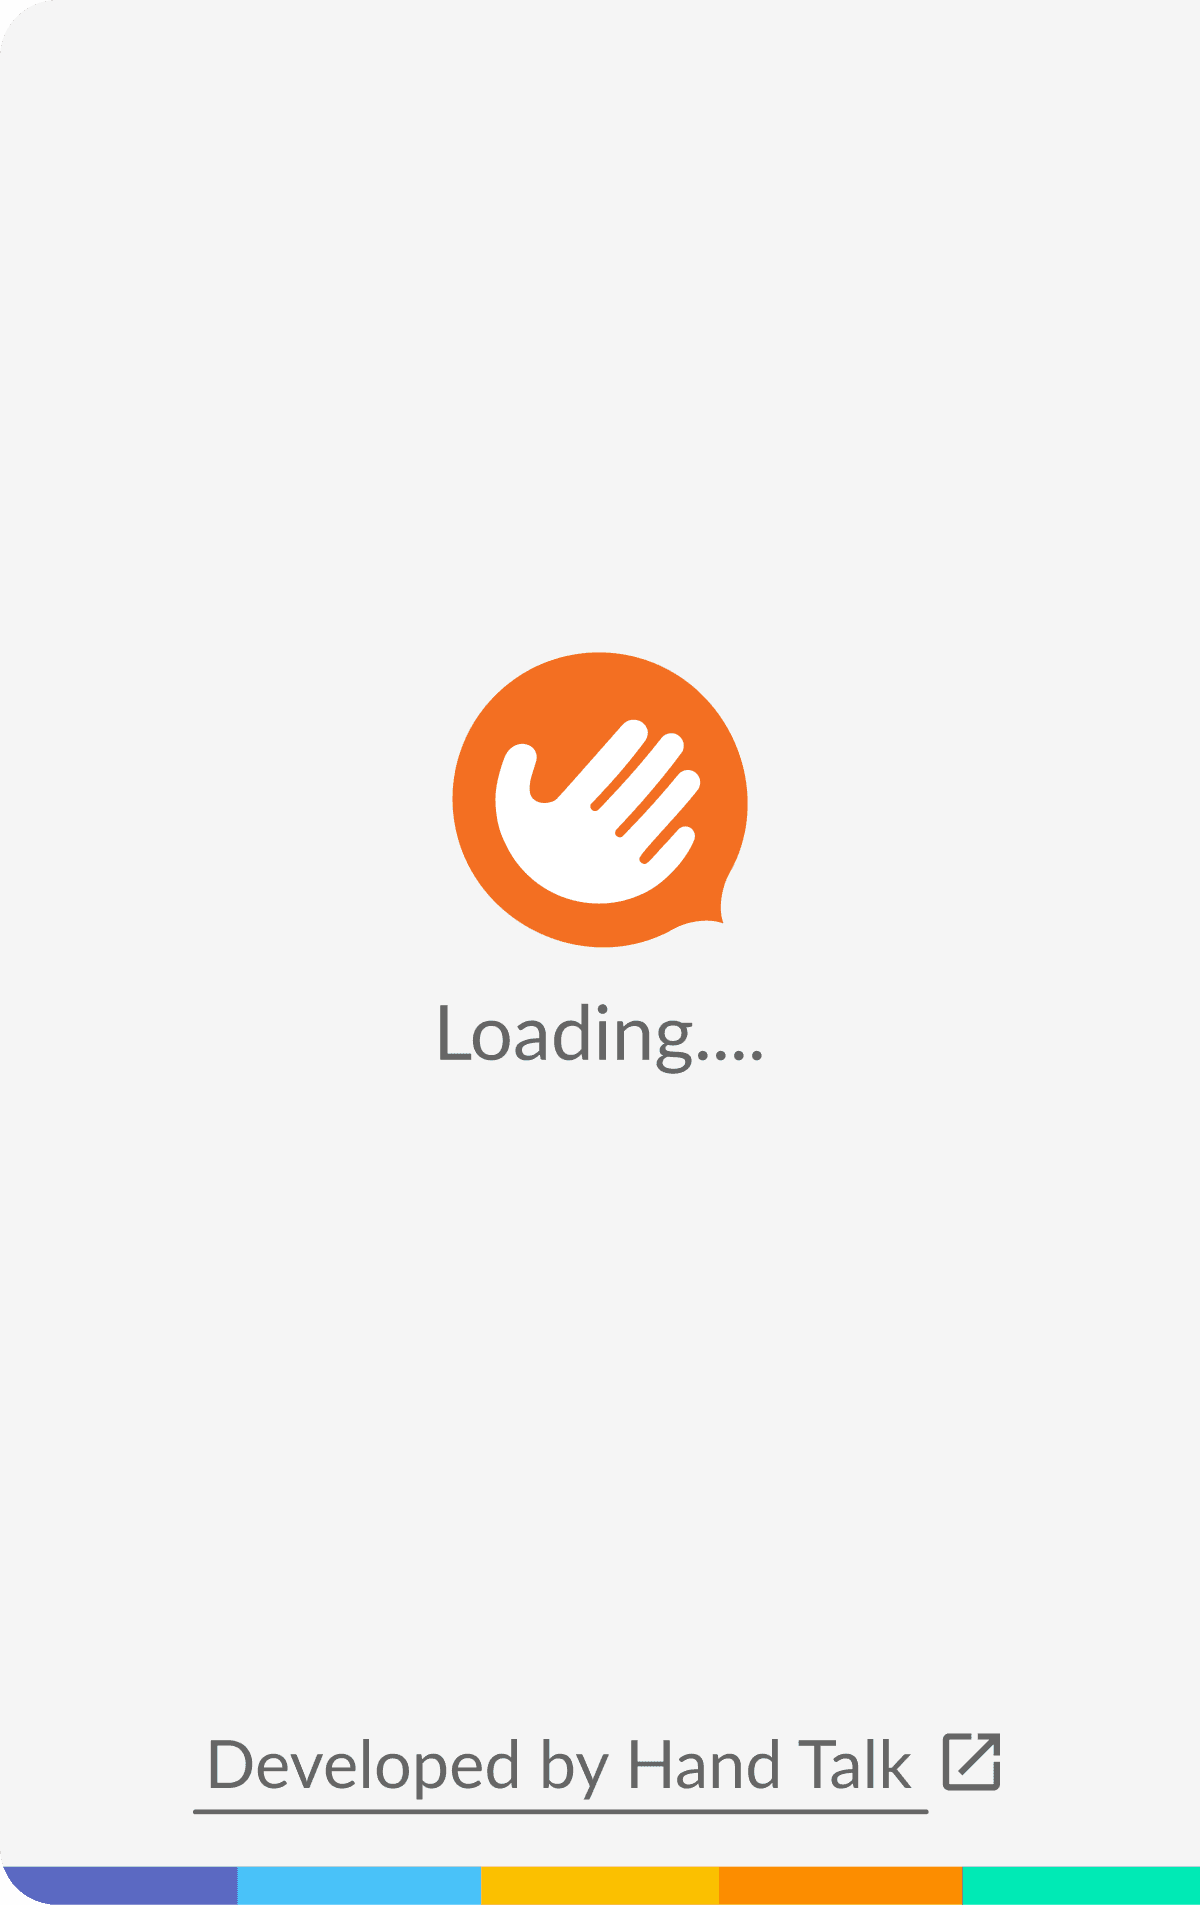
Loading screenAccess through “Developed by Hand Talk”, the link that turned out to be the problem. 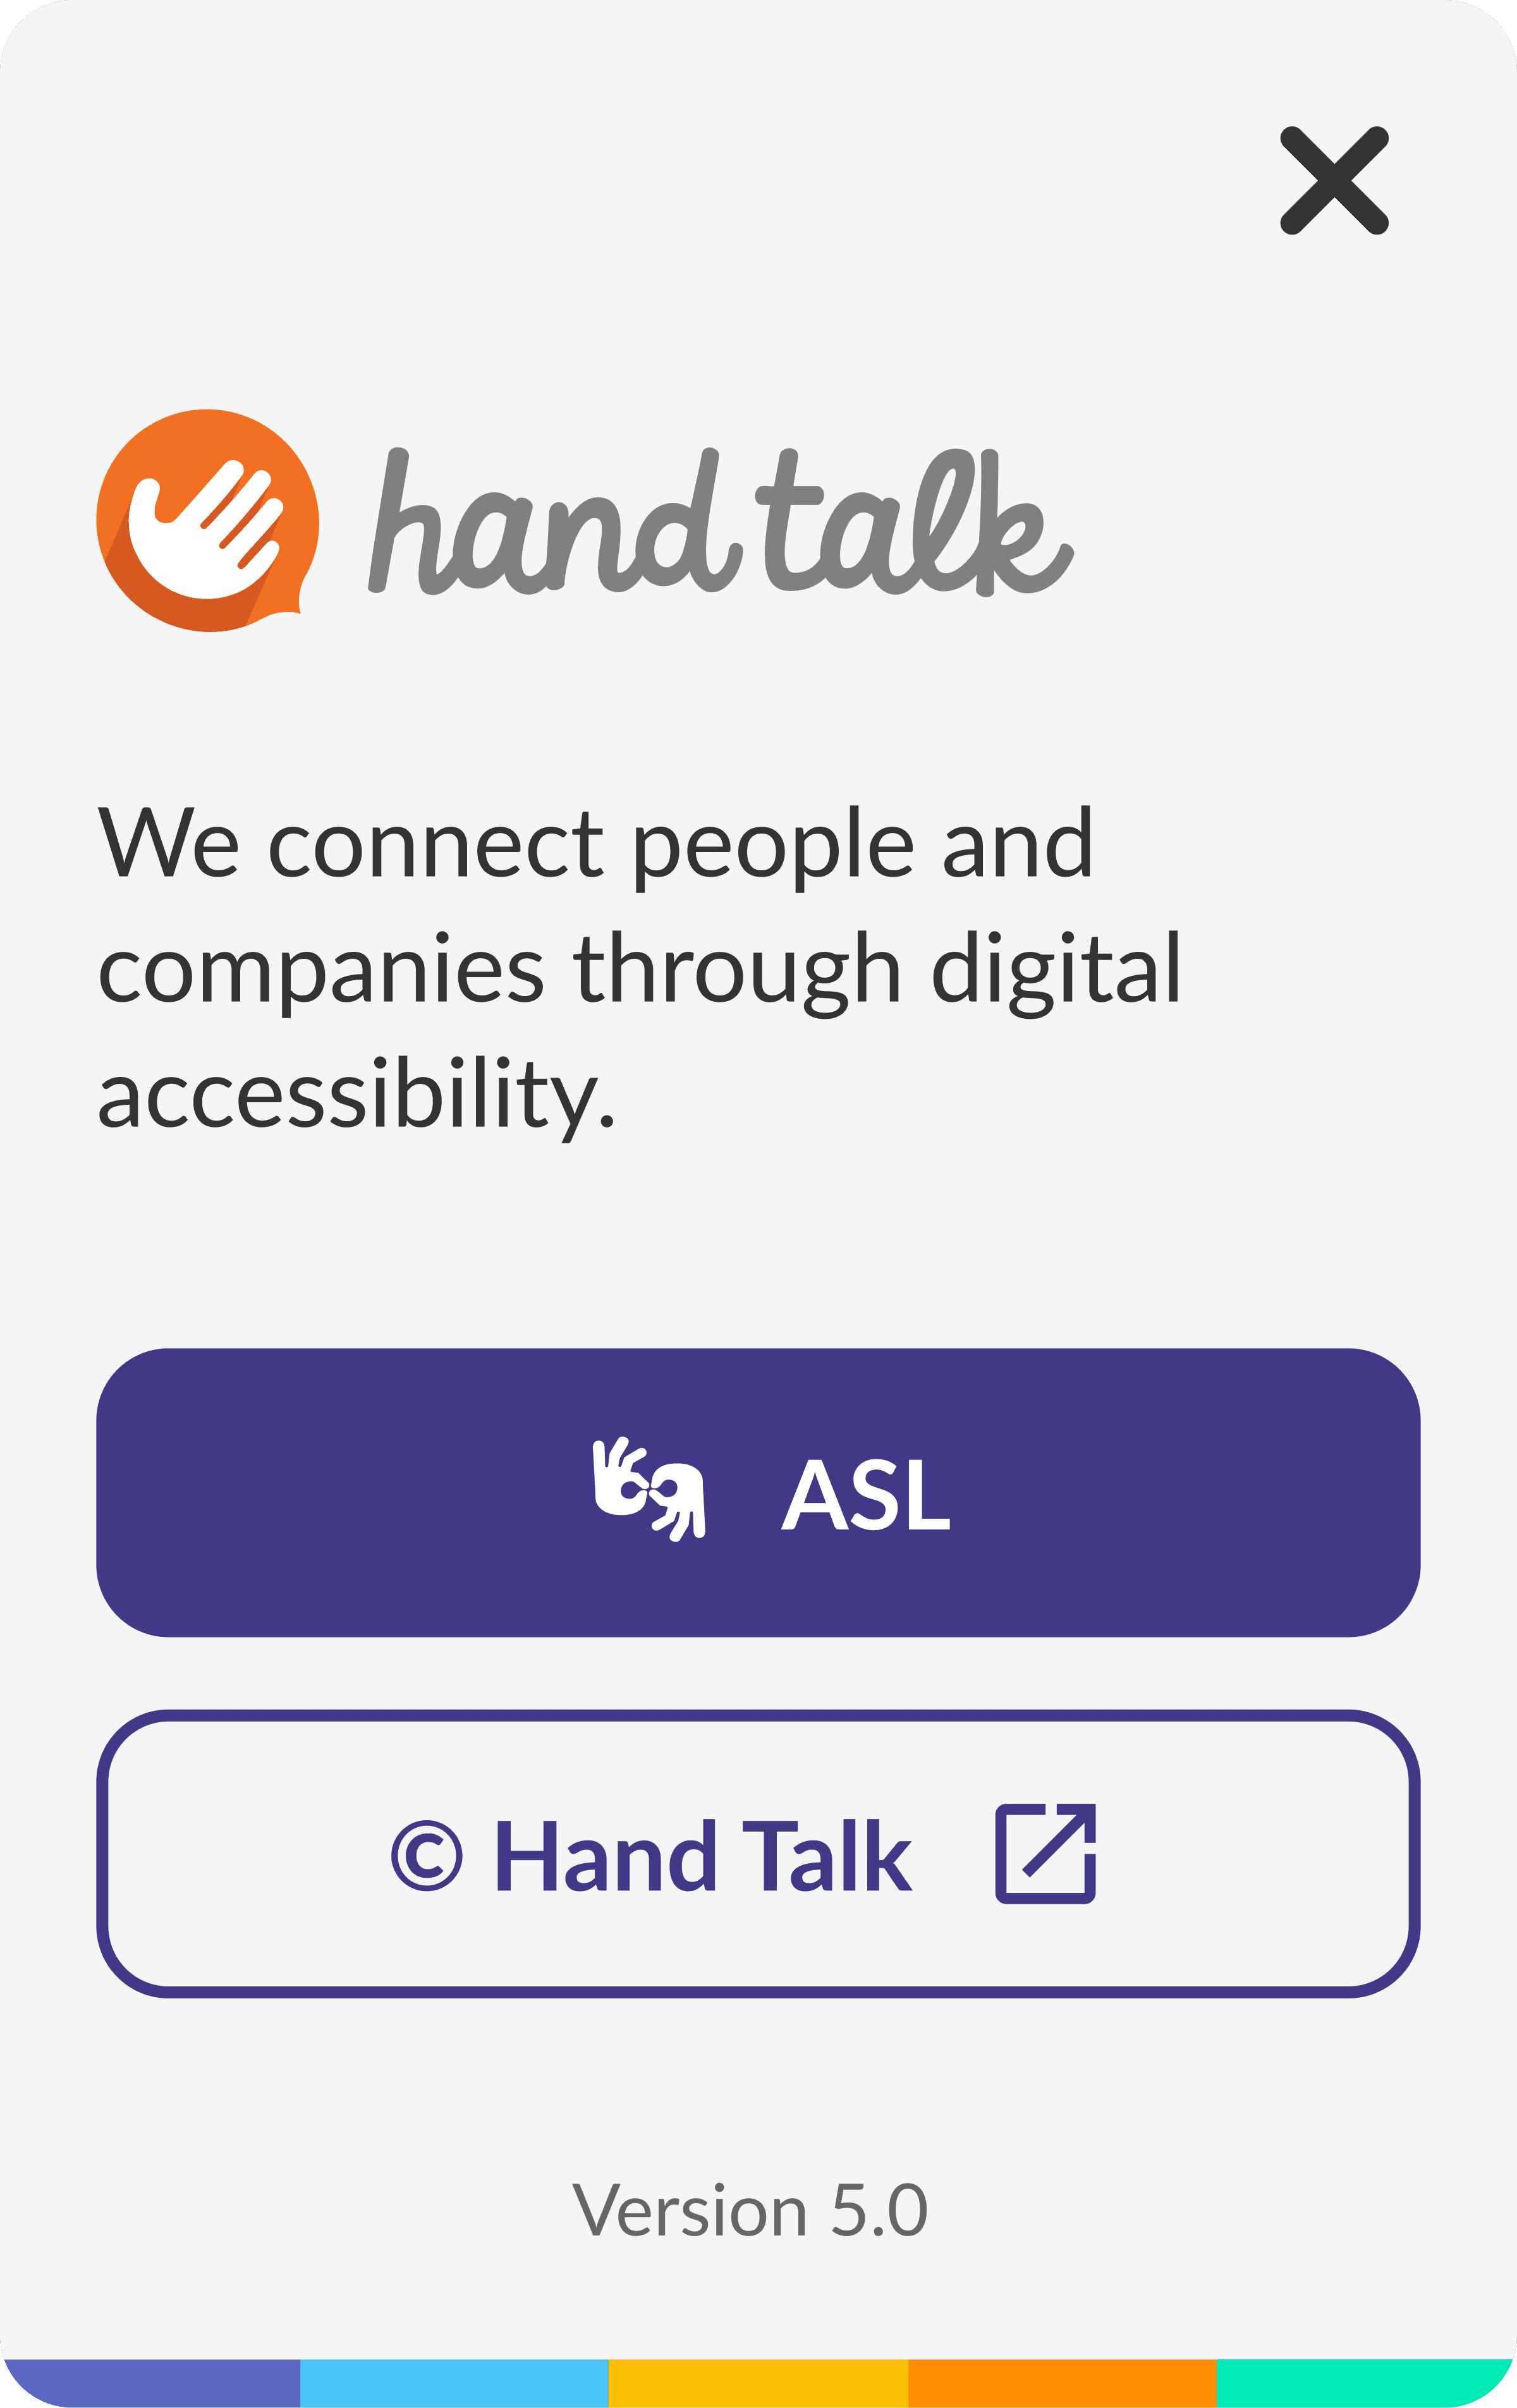
About Us screenAccess through the “Hand Talk” button, reached only by users who went looking for it.
Redirection volume
Of the total redirects to the landing page in November:
- 96% came via the loading screen
- 4% came via the About section
- All traffic appeared legitimate: real users, not bots
Top 5 referring URLs
| Referring site | Share of redirects | What it was |
|---|---|---|
| Website 1 | 21.91% | Largest enterprise client |
| Website 2 | 7.58% | Entertainment site hosting a reality show’s voting platform |
| Website 3 | 4.04% | Not identified |
| Website 4 | 3.64% | Not identified |
| Website 5 | 3.64% | Not identified |
Behavior patterns
Traffic peaked every Thursday: November 3, 10, 17 and 24. These were the live voting days for the reality show, heavily trafficked by deaf users using the plugin to translate the voting instructions.

Text description of this chart
The top blue line (website 2, the reality show voting platform) sits well above the other four sites all month and spikes sharply on 3, 10, 17 and 24 November. The green line spikes on exactly the same four dates. The orange, purple and yellow lines stay flat and low throughout.
Users weren't spamming. They were just confused.
| User assumption | What actually happened |
|---|---|
| “I’m voting on the reality show” | Plugin embedded on an external voting site |
| “I need to translate the voting buttons” | Plugin opens and shows “Made by Hand Talk” |
| “This link must confirm my vote” | User clicks and is redirected to the lead-gen landing page |
| “Raise hand = vote confirmation” | User is logged as a B2B lead |
Why this happened
Most of these users were deaf and interacting with the plugin as a translator, not as potential clients. The confusion came from:
- The "Made by Hand Talk" label appearing during plugin load
- The slow load time, which made users think they needed to "continue"
- The lack of context, leading to misdirected clicks
Redirects vs. leads
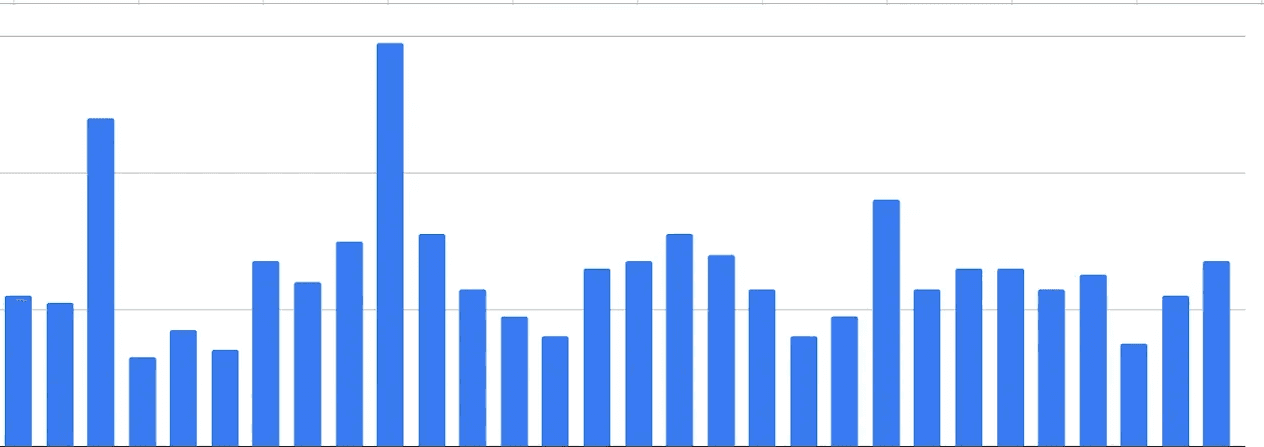
We plotted leads against plugin redirection activity, and found that:
- Disqualified leads peaked on the exact same days as the traffic from website 2
- The surge came from accidental engagement, not from legitimate interest

Text description of this chart
The blue line (total traffic across all sites) runs consistently high. The orange line (website 2) sits at zero for most of the month and rises to four isolated peaks, on 4, 10, 17 and 24 November, returning to zero in between.
Text description of this chart
Daily prospect counts are mostly low and even, broken by two conspicuously tall bars early in the month and a third mid-month, the same dates as the voting-day traffic spikes.
Solution
Loading screen redirect
Now points to the main Hand Talk homepage, where users can learn about the product and interact at their own pace.
About section redirect
Remains directed to the lead generation landing page, preserving the original purpose for users with stronger intent.
Different ways, different reasons
| Source | Qualified? | Notes |
|---|---|---|
| Plugin loading screen | No | 100% disqualified leads |
| Plugin About section | Yes | High-intent users |
| Direct access | Yes | Manual traffic, converted well |
Results
94% → 0%
Disqualified leads from the loading screen
−84pp
Drop in the overall disqualified lead rate
100%
Of valid plugin leads now come from the About section
The loading screen now directs to the home page, so valid plugin-based leads come only from the About section, and the sales team got their time back without the plugin losing any accessibility function.
Lessons learned
I understood how deeply external factors on a B2B project, like a TV show's voting schedule, can influence internal product metrics, and even reroute a team's work. The insight didn't come from screen analysis; it came from behavioural pattern detection and environmental awareness.
Not all traffic is good traffic. Context and intent matter.
Other projects.
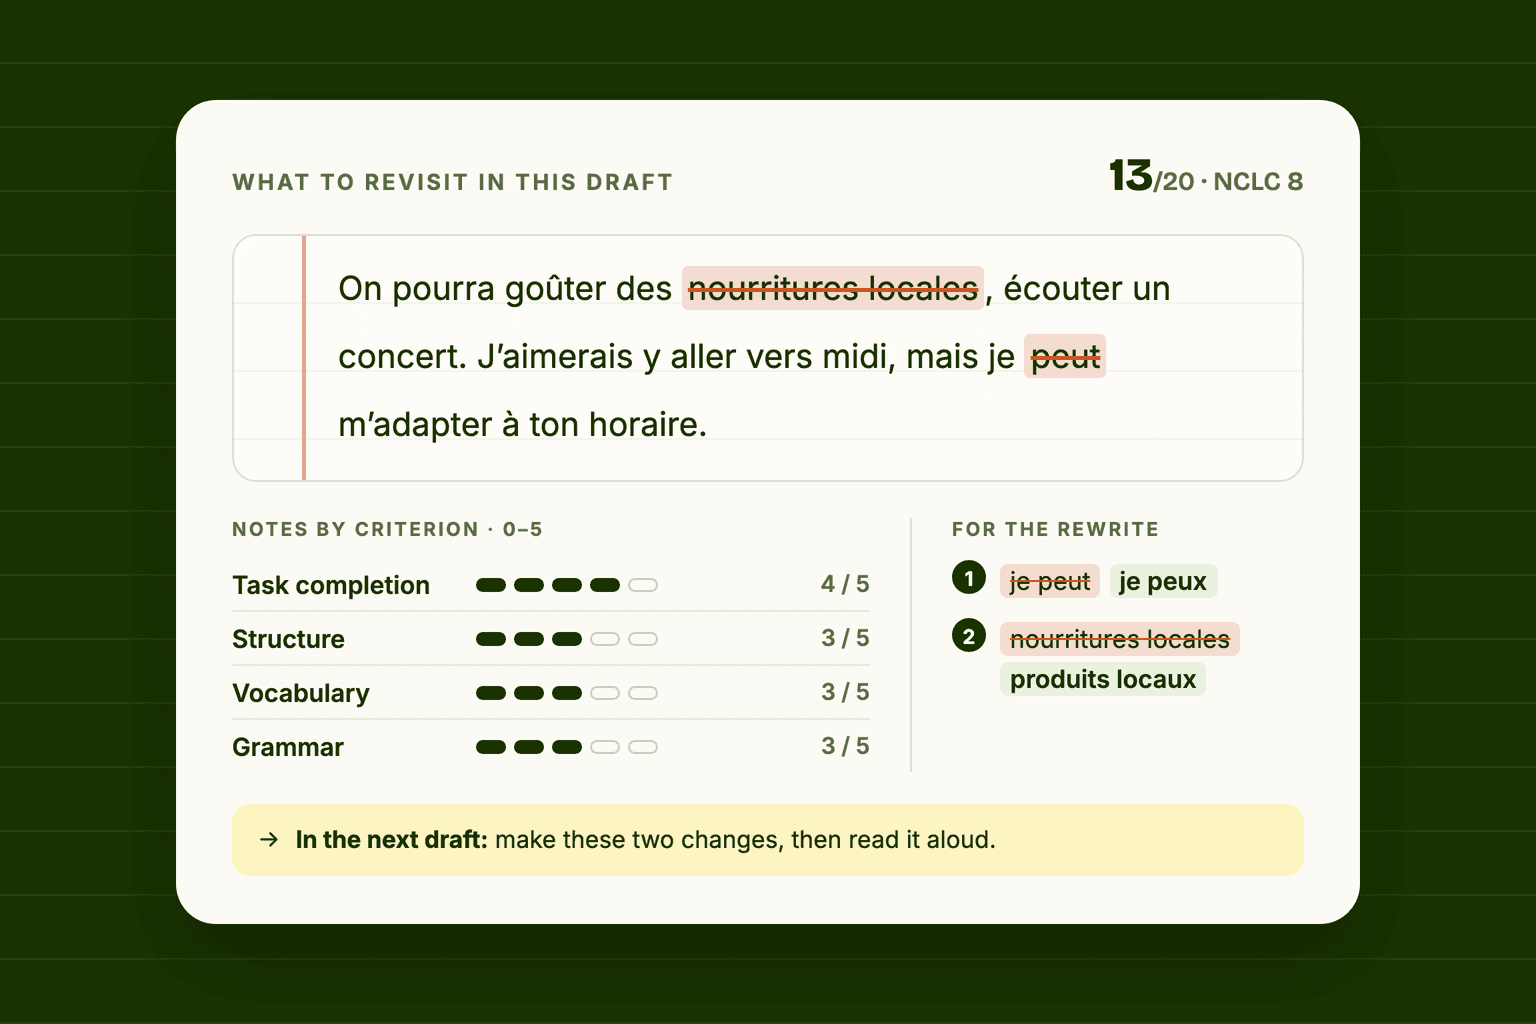
Écrivance · Nov 2025 – Present
Turning AI Feedback Into a Learning Interface
A language model will happily write four paragraphs about your French essay. None of that is a lesson. This is how I turned model output into a scored, prioritised, act-on-it-now page, for an exam I was sitting myself.
293,849 words written and corrected through the interface
- AI Interaction Design
- Product Design
- Design Systems

Hand Talk · May – July 2022
Translation Evaluation Impact Analysis
Measuring what an accessibility-led redesign of Hand Talk's evaluation screen actually changed. Evaluations rose 93.30%, and they rose while the audience shrank.
+93.30% increase in completed translation evaluations
- UX Research
- Accessibility
- Data Analysis
Hand Talk · Q3 2023
Accessibility Benchmarking for Product Roadmapping
Mapping 43 features across five competitors and prioritizing what truly matters for users and compliance.
43 features benchmarked into a 7-feature 2024 roadmap
- UX Research
- Accessibility
- Benchmarking

Hand Talk · 2022–2023
Making an Accessibility Product Measurable
Mapping 11 flows and 53 trackable states for an accessibility plugin, and building the measurement layer every later study here runs on.
11 flows mapped into 53 trackable interactions and states
- Product Analytics
- Measurement Design
- User Flows